
A few people have recently mentioned to me that they don’t understand the usefulness of tools like Amazooka or AMZ Tracker for tracking their products, after all tracking a products BSR or rankings for a particular keyword doesn’t lead to more sales, so I’m going to describe how I use them and why I find them to be important for my business.
Really I should have written this 3 months ago as a lot of people have also been asking about sales drops the last few months due to being in Q3. If these same people had graphs of their BSR and keyword rankings, and knew how to read them, they wouldn’t be asking these questions.
Amazon KPIs
Out of the many Amazon Key Performance Indicators, two that are most important and easiest to track are:
- Amazon Product’s Best Seller Ranking, or BSR. The ranking of your product in a specific amazon category, e.g. Health & Beauty.
- Amazon Keyword Ranking. The ranking of your product for a specific search keyword on Amazon

For some organisations, the process of measuring data can be a complete waste of time, measuring data and KPIs for the sake of it, without using the measurements to reach strategic goals. When used correctly however, KPIs become an important part of a company’s strategy. For the small business owner, measuring the right KPIs, understanding the data and then creating actionable items from the data can elevate a company above the competition.
I’m going to take one of my products as an example and discuss it’s BSR history and it’s keyword history as well as what the graphs tell us about it’s sales performance.
Amazon BSR Graph
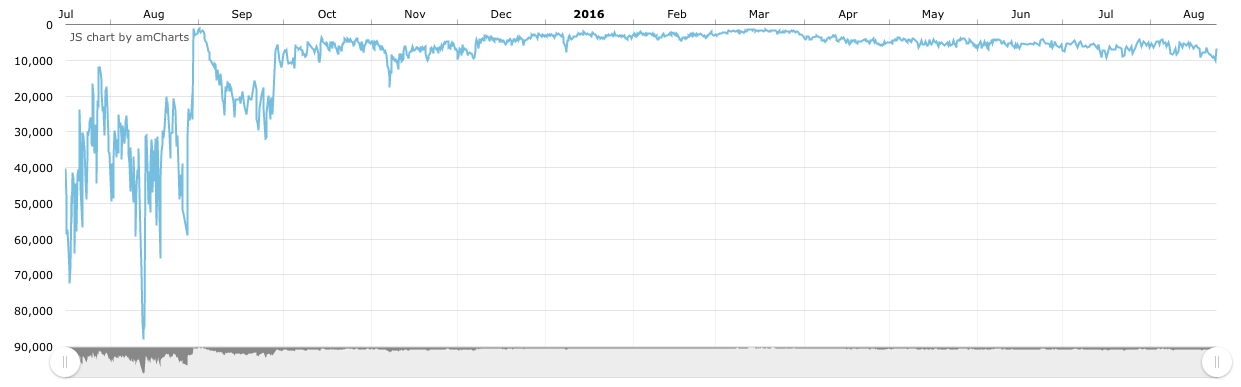
This is the Best Seller Rank graph for one of my products, since it’s launch, you can see a very jumpy first few months during the product launch, followed by an ascent towards March then followed by a slow descent. By looking at this graph, at this scale, with this one single graph, all you can really deduce is that the product had growth until March then the rankings started to slow down after March.
Amazon Keyword Graphs
Keyword Alpha
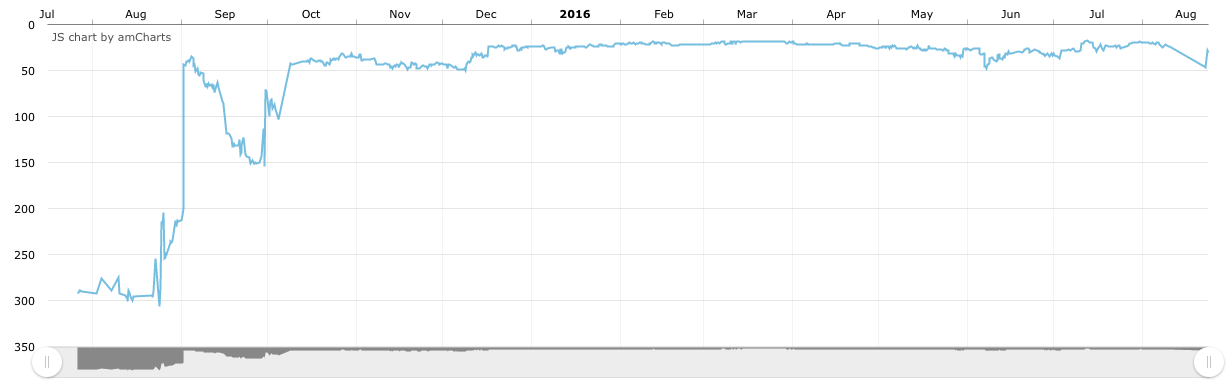
This keyword is the main product keyword, the heavy weight. It is the one people are most likely to search for and is the most competitive. For this product there is a lot of entrenched competition.
Keyword Bravo
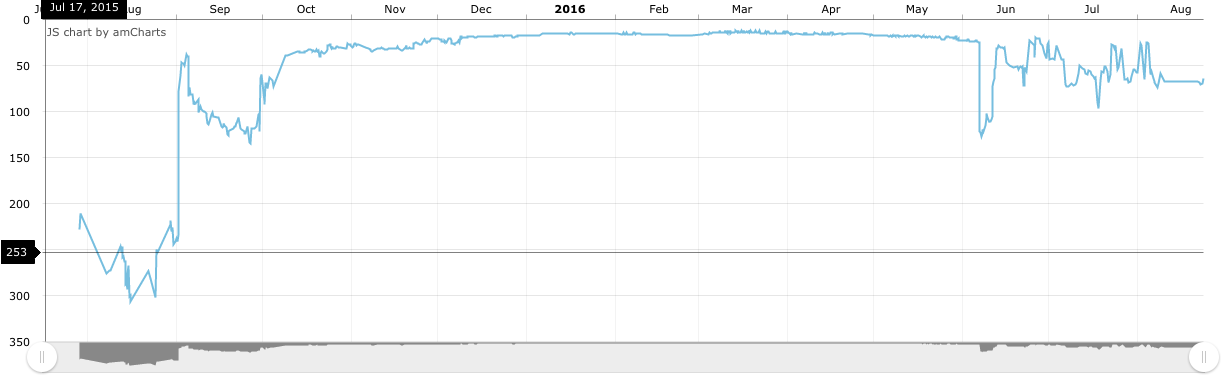
This is one of our slightly longer tail keywords, it has less searches and less competition but is still product relevant.
Keyword Charlie
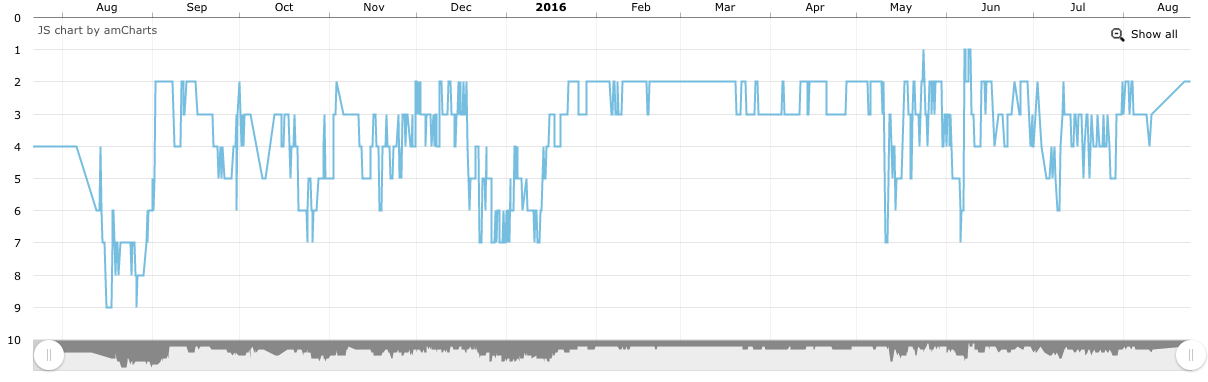
This is our long tail that keeps us where we are, we identified it during the product research phase, new that it applies specifically to our product and that there was room for us in the market then went all out to target it.
Understanding Amazon KPIs
Right, so we’ve been graphing our BSRs and our keywords and Amazon already does unit and sales KPI reporting for us, now it’s time to tie it all together to understand what is happening in our business.
1) Product Plateau
- Sales: No change
- BSR: No change
- Keyword: No change
This is the easiest case to look at, your sales are constant, your BSR is constant and your keywords is constant. In short, nothing is happening dealing with your product. Some might consider this acceptable but there is a business philosophy you might want to consider
If you’re not growing, you’re dying.
So you might want to have a look at seeing if you can grow the product now rather than worry about clawing it back later.
2) Product Category Slump
- Sales: Sales are slowing
- BSR: No change
- Keyword: No change
If your sales are slowing but your BSR is constant and your keywords are constant then this will be due to a variation in your product category. Simply, for whatever reason, people are buying less products in your category so it’s not that different really to the product plateau case. This is a perfect example for what happens during Q3, which is the slowest time for commerce, so if sales are down but your products meet these KPI criteria, it’s not too much to worry about, but try to focus on growing it some how.
3) Product Niche Slump
- Sales: Sales are slowing
- BSR: BSR is dropping
- Keyword: No change
If your sales are slowing and your BSR is dropping but your keyword rankings have no change, then this means there is a variation in your product niche. Perhaps you are selling Christmas hats during the summer, even if you’re ranked #1 for all your keywords you’re still going to make less sales than you would on the run up to Christmas.
4) Product Slump
- Sales: Sales are slowing
- BSR: BSR is dropping
- Keyword: Keyword is dropping
IF your sales are slowing and your BSR is dropping make sure to check all your keyword graphs because if it isn’t a seasonal or niche slump then it might be because your product is losing keyword rankings which is effecting your BSR and sales volume. This could be your rankings for just one keyword has changed or it could be your rankings for several keywords.
5) Product Category Boost
- Sales: Sales are increasing
- BSR: No change
- Keyword: No change
When sales are increasing but there is no change in your Amazon BSR or keyword rankings then the opposite of #2 is happening, sales in your product category are picking up and taking you along for the ride.
6) Product Niche Boost
- Sales: Sales are increasing
- BSR: BSR is increasing
- Keyword: No change
When sales are increasing and your BSR is increasing but there is no change in your keyword rankings then the opposite of #3 is happening. Sales for your particular niche are picking up again.
7) Product Boost
- Sales: Sales are increasing
- BSR: BSR is increasing
- Keyword: Keyword is increasing
When sales are increasing and your BSR is increasing you again also want to check your keyword rankings as if one or more keyword ranking is increasing that could also be driving more sales for you, again this is the opposite of #4. It could be a single keyword or all of them.
Keyword Observations
Changes In One Keyword
If just one of your keyword rankings is changing, it is more than likely something in your copy has changed that is fundamental to that keyword. It could be a search term has been added or removed.
Changes Across All Keywords
If the majority, or all, of your keywords are seeing change than it is more than likely an issue relating to the conversion rate of your product page. With out going in to too much detail, this could be due to a change in your title, images, review average, number of reviews, quality of the latest reviews or copy.
Graph Observations
So with these case studies in mind I’m going to reflect on several events relating to my product and what the graphs tell us.
July 2015 – August 2015
- BSR: BSR is all over the place
- Keyword Alpha: Massive ranking improvement
- Keyword Bravo: Massive ranking improvement
- Keyword Charlie: Massive ranking improvement
July to August was the initial product launch so the BSR was all over the place. Keywords Alpha and Bravo were jumpy then found there place whilst our long tail, Charlie, came straight in at 4th due to a properly optimised sales page then move us to 2nd place. This is my launch and product strategy in a nut shell, get a product to rank for a long tail that makes sales, leverage the position over time to grow rankings for other, harder keywords. This is a classic case of #7, a product boost.
September 2015
- BSR: BSR is dropping
- Keyword Alpha: Rankings are dropping
- Keyword Bravo: Rankings are dropping
- Keyword Charlie: Rankings are dropping
September we had a ‘good problem to have’, we ran out of inventory so sales slowed whilst we got everything back together, as such all our rankings dropped. This is a classic case of #4, a product slump.
October 2015 – November 2015
- BSR: BSR is increasing
- Keyword Alpha: Rankings plateau
- Keyword Bravo: Rankings are increasing
- Keyword Charlie: Rankings plateau
October to November was great, We saw steady BSR growth whilst keyword Alpha and keyword Charlie plateaued. We can see keyword Bravo steadily increase driving that growth however. This is another case of #7, a product boost, but driven by a single keyword, Charlie.
December 2016 – March 2016
- BSR: BSR is increasing
- Keyword Alpha: Rankings are increasing
- Keyword Bravo: Rankings are increasing
- Keyword Charlie: Rankings plateauing
December to March was great, everything showed growth, our BSR and our keyword rankings, we made the big time, this is another case of #7 product boost but was driven by all our keywords. You can see the knock on effect take place, our long tail Charlie helped us grow so we could start ranking for the shorter tail Bravo which then got us on to the first page for our actual target keyword Alpha. It has to be said, Charlie was plateauing because we were already at the top, there wasn’t really anywhere for that keyword to grow!
March 2016 – June 2016
- BSR: BSR is dropping
- Keyword Alpha: Rankings are dropping
- Keyword Bravo: Rankings are dropping
- Keyword Charlie: Rankings plateau
One of the problems with success is Amazon start to take notice and after our period of growth March came and with it so did our page 1 ranking, then from March to June we entered a period of slow decline, so what happened? The first 2 pages or so of most product categories contain very boring product titles Brand Name – Product Name. I’ve seen a lot of people talk about Amazon using short product names as a ranking factor due to this observation to the point of fact some experts recommend going with short titles due to this observation bias. The truth of the matter is the opposite. Amazon have a product listings clean up crew!
I had a slightly longer title that included more description as well as some benefits to our product, Amazon nerfed it in favour of Brand Name – Product Name to make the search indexes more pleasant. This did three things
- Kill click throughs
- Kill sales
- Kill rankings
There are some fundamental problems with what Amazon did to our listing, e.g. consider the effect of the Amazon sales team renaming Acme – Wooden Baby Spoon to Acme – Spoon. Now people searching for a spoon for their baby, or a wooden spoon, or a wooden spoon for their baby, won’t choose our product, but this isn’t the time to go in to the ramifications of that.
In short, due to the title change, our clickthrough rate decreased which caused the product to lose sales and keyword rankings. A classic case of #4, product slump. Our keyword Charlie is still holding on strong.
### June 2016 – July 2016
- BSR: BSR is dropping
- Keyword Alpha: Rankings are dropping
- Keyword Bravo: Rankings are dropping
- Keyword Charlie: Rankings plateau
The big difference between June/July and the previous period stems from just one keyword, keyword Bravo. Because of the title change it removed a descriptive word directly relating to this keyword and we are seeing the ramifications of that clearly now. The solution to this problem is to try and get that keyword back in to the title or in the page to help increase rankings for it. This is the first obvious action item that the graphs have given us. We need to get our rankings back for keyword Bravo asap!
August 2016
- BSR: BSR is dropping fast
- Keyword Alpha: Rankings are dropping fast
- Keyword Bravo: Rankings are dropping fast
- Keyword Charlie: Rankings plateau
August has been interesting, we still haven’t got keyword Bravo back in yet but we did get something else going on. I’ve been trying for 2 years to join the Amazon subscribe & Save program under the assumption that the subscriptions will drive more sales and I’ll make more money! The truth of the matter is that it’s killed our conversion rate so our BSR and keywords Alpha and Bravo are plummeting faster than ever whilst we are seeing sales decline and no subscriptions occur.
My first action task after this is to get rid of Subscribe & Save.
Summary
Whilst tracking Amazon BSR and keyword positions for your products won’t in themselves lead to more sales, they are very important KPIs to monitor and shouldn’t be ignored as they can let you fully understand what is happening with your business and empower you to make intelligent decisions accordingly.
Whilst most people are already using tools like Amazooka or AMZ Tracker for their product giveaways, the importance of tracking KPIs is often understated as they don’t in themselves have an obvious ROI whilst an auto responder or a product giveaway has an obvious and visible impact on your bottom line.
From observing my graphs I am now going to turn things round by improving my keyword rankings for Bravo and removing Subscribe & Save to improve my on page conversion rate.